

As green hydrogen transitions from pilot projects to gigawatt-scale industrial deployments, engineering teams face a primary techno-economic challenge: minimizing the Levelized Cost of Hydrogen (LCOH). While technology vendors often emphasize stack efficiency improvements or capital expense reductions, the dominant sensitivity vectors in real-world deployment remain the levelized cost of electricity (LCOE) and the annual plant capacity factor (CF).
At Avoltium, our engineering design framework evaluates these variables simultaneously rather than as decoupled parameters. This article presents a deep dive into the mathematical relationships governing LCOH sensitivity, stack degradation mechanics, dynamic balance-of-plant (BoP) parasitic loads, and capital amortization curves.
Mathematical Framework of Levelized Cost of Hydrogen
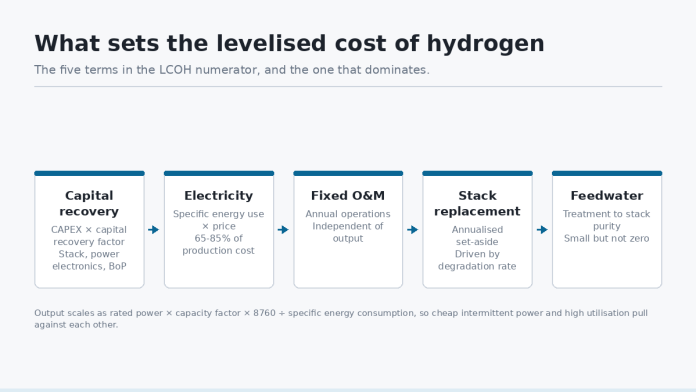
To evaluate sensitivity accurately, we must first establish the complete LCOH expression. LCOH represents the total lifetime cost of building and operating the hydrogen production facility divided by the total mass of hydrogen produced over the system lifetime:
LCOH = [ (CAPEXtotal × CRF) + OPEXfixed + (SEC × Pelec × MH2,annual) + Cstack_replace + Cwater ] / MH2,annual
Where:
- CAPEXtotal: Total capital expenditure including electrolyzer stack, power electronics, balance of plant, water treatment, and civil works ($).
- CRF: Capital Recovery Factor = [ i(1+i)n ] / [ (1+i)n – 1 ], where i is the discount rate and n is plant lifetime in years.
- OPEXfixed: Annual fixed operation and maintenance costs ($/year).
- SEC: Specific Energy Consumption of the electrolyzer system (kWh/kg H2).
- Pelec: Weighted average electricity price ($/kWh).
- MH2,annual: Total annual mass of hydrogen produced (kg).
- Cstack_replace: Annualized capital set-aside for cell stack replacement ($/year).
- Cwater: Annual cost for high-purity feedwater treatment ($/year).
The annual hydrogen production capacity is directly governed by the system capacity factor (CF):
MH2,annual = (Prated × CF × 8760) / SEC
Where Prated is the nameplate electrical power of the electrolysis plant in kW, and 8760 represents total hours in a non-leap year.
Sensitivity to Electricity Price: The OpEx Dominance
Because the lower heating value (LHV) of hydrogen is 33.33 kWh/kg, a perfectly efficient electrolyzer operating at 100% LHV efficiency would consume 33.33 kWh/kg. Commercial systems—incorporating stack thermodynamic losses, AC/DC rectification, water treatment parasitic loads, thermal management, and gas drying/compression—typically operate at a system-level SEC of 50 to 58 kWh/kg H2.
Given this high energy consumption per unit mass, electricity pricing acts as an exponential driver on marginal production costs. At a nominal system SEC of 52 kWh/kg:
- At 20/MWh), energy cost contributes $1.04/kg to LCOH.
- At 50/MWh), energy cost contributes $2.60/kg to LCOH.
- At 100/MWh), energy cost contributes $5.20/kg to LCOH.
“At high capacity factors, every 0.50 to $0.55 per kilogram of hydrogen, eclipsing nearly all realistic balance-of-plant CapEx reductions.”
This high sensitivity explains why plant location choice is heavily biased toward regions offering low-cost renewable generation (e.g., dedicated solar/wind corridors). However, ultra-low electricity prices are often linked with low capacity factors due to the intermittency of renewable generation.
Capacity Factor Sensitivity & Capital Amortization
Capacity factor measures how continuously the plant runs at full nameplate power over a year. When an electrolyzer operates at a low capacity factor (e.g., 20–25% when coupled directly to a solar PV facility without energy storage), fixed capital charges (CAPEXtotal × CRF) and fixed OPEX are divided over a significantly smaller total mass of produced hydrogen (MH2,annual).
This dynamic creates a hyperbolic LCOH penalty curve at low capacity factors:
The Low-CF Penalty Dynamic
Consider a $1,200/kW installed system CAPEX. At a 10% discount rate over a 20-year lifetime, the annual capital charge is roughly $141/kW-year. If the system operates at a 90% capacity factor (7,884 hours/year) with an SEC of 52 kWh/kg, it produces approximately 151.6 kg H2 per kW-year. The capital cost component of LCOH is thus $0.93/kg H2.
If that same system operates at a 20% capacity factor (1,752 hours/year), annual production drops to 33.7 kg H2 per kW-year. The capital cost component rises to $4.18/kg H2—a 350% increase in capital amortization per unit of product output.
“Operating an advanced proton exchange membrane electrolyzer at low capacity factors to capture ultra-low electricity prices creates a non-linear CapEx penalty that often outweighs the energy cost savings.”
Techno-Economic Sensitivity Matrix
The matrix below demonstrates the calculated LCOH ($/kg H2) across varying electricity costs and capacity factors for a modern megawatt-scale Proton Exchange Membrane (PEM) electrolyzer plant. Calculations assume a total installed CAPEX of $1,100/kW, a 20-year plant life, an 8% discount rate, stack replacement every 60,000 hours, and a baseline system SEC of 52 kWh/kg H2.
| Capacity Factor | Electricity: $10/MWh | Electricity: $30/MWh | Electricity: $50/MWh | Electricity: $70/MWh |
|---|---|---|---|---|
| 20% (Solar Direct) | $4.82 / kg | $5.86 / kg | $6.90 / kg | $7.94 / kg |
| 40% (Wind Direct) | $2.71 / kg | $3.75 / kg | $4.79 / kg | $5.83 / kg |
| 65% (Wind + Solar Hybrid) | $1.88 / kg | $2.92 / kg | $3.96 / kg | $5.00 / kg |
| 90% (Grid-Tied Continuous) | $1.49 / kg | $2.53 / kg | $3.57 / kg | $4.61 / kg |
Dynamic Operation, Degradation, and Balance of Plant Considerations
The relationship between power price and capacity factor is non-linear due to physical stack dynamics and auxiliary plant loads. When evaluating system efficiency, engineers must account for several thermodynamic and operational realities:
1. Current Density and Polarisation Curves
The cell operating voltage Vcell is governed by the reversible potential, activation overpotentials, ohmic losses, and mass transport losses:
Vcell = Erev + ηanode + ηcathode + i · Rohmic + ηmass_transport
At high current densities (e.g., i > 2.5 A/cm2), total stack power output rises, lowering upfront stack CAPEX per rated kW. However, higher current density drives up cell voltage Vcell, increasing system SEC (kWh/kg) and elevating electricity cost sensitivity. Conversely, derating the electrolyzer stack to run at lower current densities improves instantaneous electrical efficiency (lowering SEC down toward 45 kWh/kg), but increases stack CAPEX per unit of capacity.
2. Dynamic Degradation Mechanisms
Rapid load cycling associated with intermittent power input (low capacity factor operations) accelerates structural degradation in both PEM and Alkaline systems. Membrane thinning, catalyst dissolution/agglomeration, and passivating oxide layer growth increase ohmic resistance over time. A typical degradation rate of 1.0% to 2.5% per 1,000 operational hours increases SEC gradually over stack life, degrading LCOH economics over time.
3. Water Treatment and Auxiliary Parasitic Loads
A often under-analyzed component of plant design is the balance-of-plant requirements, particularly the water treatment system. Commercial electrolyzer stacks require ultra-pure water with an electrical resistivity greater than 18 MΩ·cm to prevent catalyst poisoning and membrane contamination. A typical facility requires 9 to 10 liters of deionized water per kilogram of produced hydrogen.
The water treatment system—utilizing multi-stage Reverse Osmosis (RO) followed by Electrodeionization (EDI)—involves auxiliary pumping loads and maintenance costs. While raw water and purification energy add roughly 0.08 per kg of H2, poor feedwater quality dramatically accelerates stack degradation, impacting lifetime SEC and stack replacement frequency.
Engineering Strategy for Plant Optimization
To navigate the sensitivity trade-offs between low capacity factors and high electricity costs, Avoltium recommends three core architectural strategies during project development:
A. Hybrid Resource Aggregation
Combining complementary renewable profiles (e.g., co-located wind and solar PV) increases overall system capacity factor from ~25% (solar only) to 55–65% without relying on expensive grid connections. This mitigates the steep capital amortization penalty while keeping average LCOE below $35/MWh.
B. Dynamic Stack Overdimensioning & Turning-Down
Configuring multi-module electrolyzer plants to operate dynamically allows individual stacks to run near their thermal and electrochemical efficiency sweet spot (typically 30–60% partial load). During low power availability, stacks run at reduced current density (high efficiency, lower SEC); during power surges, stacks flex up to full rating.
C. Waste Heat Integration
By recovering low-grade waste heat (60°C to 80°C) from stack thermal management loops and using it for local industrial processes or district heating networks, operators can capture additional revenue streams. This effectively offsets a portion of incoming electricity costs, lowering the net LCOH by 0.45/kg H2 equivalent.
Conclusion
LCOH optimization cannot be solved by focusing solely on individual component performance or low electricity costs in isolation. The sensitivity matrix confirms that while low power pricing is essential, running an electrolyzer facility at capacity factors below 40% incurs severe structural financial penalties through capital underutilization. Modern green hydrogen engineering requires strict co-optimization of array sizing, operating current densities, water treatment integration, and dynamic power dispatch strategy to deliver cost-competitive clean hydrogen at scale.
Author: Arun, Chief Engineer at Avoltium