
Beyond the Tariff: The Real Engineering Barrier to Indian Hydrogen Exports
India’s National Green Hydrogen Mission has established an aggressive operational target: producing 5 million metric tonnes per annum (MMTPA) of green hydrogen by 2030, with a major fraction earmarked for export to North European and East Asian markets. While political directives focus on India’s enviable ultra-low solar photovoltaic power purchase agreements (PPAs)—frequently under $0.03/kWh—the engineering reality of delivering low-carbon molecules to deep-water ports is governed by strict electrochemical, thermodynamic, and balance-of-plant (BoP) constraints. For India to achieve a competitive Levelized Cost of Hydrogen (LCOH) in the range of 2.00/kg at the plant gate, design engineers must look beyond the generation boundary and optimize the total conversion system, from raw seawater intake to carrier synthesis.
Electrolyzer Stack Dynamics and Power Quality Engineering
The primary driver of stack-level LCOH is the interplay between operating current density, specific energy consumption, and dynamic load handling under variable renewable generation. Currently, state-of-the-art pressurized Alkaline Electrolyzer Cell (AEC) systems operate at current densities of 0.3 to 0.6 A/cm2, achieving stack-level energy efficiencies of roughly 48 to 52 kWh/kg H2. Proton Exchange Membrane (PEM) systems operate at much higher current densities—typically 1.5 to 2.5 A/cm2—offering a footprint up to 70% smaller, but at a higher stack CAPEX and slightly elevated specific power consumption (50 to 55 kWh/kg H2).
Dynamic Response and Gas Purity Risks
Coupling electrolyzers directly to variable solar and wind assets presents severe operational challenges. AEC systems exhibit high thermal mass and limited dynamic turndown ratios (typically limited to 20%–100% of nominal load). Operating below this threshold causes cross-permeation of gases through the porous separator, risking explosive hydrogen-in-oxygen concentrations (>2% H2 in O2 by volume) and triggering automated safety shutdowns. While PEM electrolyzers handle millisecond-scale power fluctuations better, rapid power cycling accelerates catalyst dissolution, membrane thinning, and interface resistance growth.
Power Conditioning and Harmonic Suppression
At multi-hundred-megawatt scale, rectifiers are critical BoP assets rather than simple off-the-shelf components. Standard 12-pulse thyristor rectifiers inject significant total harmonic distortion (THD) into the upstream microgrid and induce current ripple on the DC side. High DC current ripple (>5%) induces accelerated degradation of catalyst layers and increases parasitic heating in both AEC and PEM stacks. Designing custom Active Front End (AFE) IGBT-based rectifiers keeps THD under 3% and DC ripple below 1%, extending operational stack lifetime toward the 80,000-hour benchmark necessary for bankable project finance.
“The true levelized cost of green hydrogen is defined at the phase change: kilowatt-hours spent on power conditioning, purification, and molecular carrier synthesis often outweigh micro-efficiencies gained within the stack itself.”
The Water Treatment Imperative: Ultrapure Feedstock at Scale
A frequently underestimated operational bottleneck in India’s export hubs—such as Kandla, Paradip, and Kakinada—is the supply of process water. The stoichiometry of water electrolysis dictates a minimum requirement of 8.94 kg (or liters) of pure H2O per kilogram of H2 produced. In industrial practice, however, systemic water consumption is vastly higher.
Including pretreatment losses, continuous electrodeionization (CEDI) rejection, and cooling tower evaporative losses under high ambient Indian climatic conditions (ambient temperatures exceeding 40°C), total raw water demand ranges between 18 and 28 liters per kilogram of hydrogen. Because export plants will be co-located along coastal industrial corridors, Seawater Reverse Osmosis (SWRO) must serve as the primary water source.
Treatment Train Architecture for Stack Longevity
Electrolyzer manufacturers enforce extremely strict feedwater standards to prevent catalyst poisoning and membrane scaling. Stack feed must typically meet ASTM Type I water specs, requiring electrical conductivity below 0.1 µS/cm and Total Organic Carbon (TOC) under 50 ppb. Achieving this quality from raw seawater (TDS ~35,000 mg/L) requires a robust multi-stage treatment sequence:
- Primary Pretreatment: Ultrafiltration (UF) to remove suspended solids, microalgae, and silt density index (SDI < 2).
- Desalination: High-recovery Seawater Reverse Osmosis (SWRO) followed by a secondary Brackish Water Reverse Osmosis (BWRO) pass, dropping total dissolved solids to < 10 mg/L.
- Polishing Loop: Continuous Electrodeionization (CEDI) backed by ultraviolet (UV) TOC destruction units and mixed-bed ion-exchange polishing to guarantee < 0.1 µS/cm conductivity.
The parasitic load of this full water treatment configuration adds approximately 0.5 to 1.2 kWh per kilogram of H2 produced—a manageable energy penalty, provided scale and energy recovery devices (ERDs) are properly integrated into the hydraulic design.
Carrier Conversion Thermodynamics: The Export Vector Decision
Exporting molecular hydrogen across ocean basins requires densification. Gaseous transport at 350 to 700 bar is economically non-viable for transoceanic trade due to low volumetric density (approx. 1.2 to 2.3 kWh/L) and extreme pressure-vessel costs. Indian exporters must select between two primary chemical vectors: Liquid Hydrogen (LH2) and Green Ammonia (NH3).
Liquid Hydrogen (LH2)
Liquefaction requires cooling hydrogen gas down to -253°C at atmospheric pressure. The thermodynamic minimum energy required for liquefaction is roughly 3.9 kWh/kg H2, but commercial Claude-cycle liquefaction plants operate at efficiencies requiring 10 to 13 kWh/kg H2. This single step consumes between 20% and 25% of the lower heating value (LHV) of the hydrogen feedstock. Boil-off losses during marine transport (0.15% to 0.3% per day) further degrade the net delivered energy efficiency.
Green Ammonia Synthesis (NH3)
Synthesizing green ammonia via the classic Haber-Bosch reaction (N2 + 3H2 → 2NH3) operating at 150 to 250 bar and 400°C to 500°C introduces an auxiliary Air Separation Unit (ASU) for cryogenic nitrogen extraction. The overall conversion penalty consumes 7 to 9 kWh/kg of equivalent H2. Crucially, ammonia liquefies at a manageable -33°C at atmospheric pressure (or 8.5 bar at ambient 20°C ambient), leveraging decades of established global maritime transport infrastructure, terminal storage, and safety protocols.
Engineering Directives for Plant Designers
For engineering teams designing India’s next-generation green hydrogen hubs, successful deployment relies on execution across three critical boundaries:
- Integrated Heat Recovery: Capture exothermic heat from the Haber-Bosch reaction and compressor intercoolers to drive thermal desalination systems or preheat steam for high-temperature solid oxide electrolyzer cells (SOEC), pushing total system efficiency past 70%.
- Hybrid Microgrid Topology: Pair solar and wind resources with short-duration battery energy storage (BESS) to maintain electrolyzer operations within a stable 40%–100% capacity range, protecting stack catalysts from harsh transient cycling.
- Total Water Management: Design zero-liquid discharge (ZLD) systems on coastal water treatment trains to eliminate concentrated brine rejection issues while maintaining absolute compliance with electrolyzer conductivity specifications (< 0.1 µS/cm).
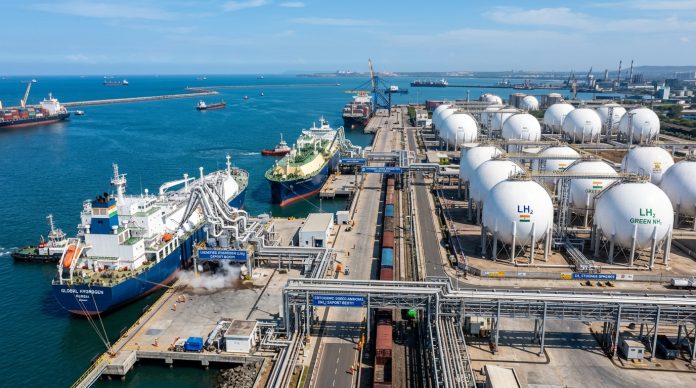
Image: Container-Terminal Bremerhaven 01 by H. Zell, licensed under CC BY-SA 3.0.