
The Misapplied Analogy: Why Electrolyzers Aren’t Solar Panels
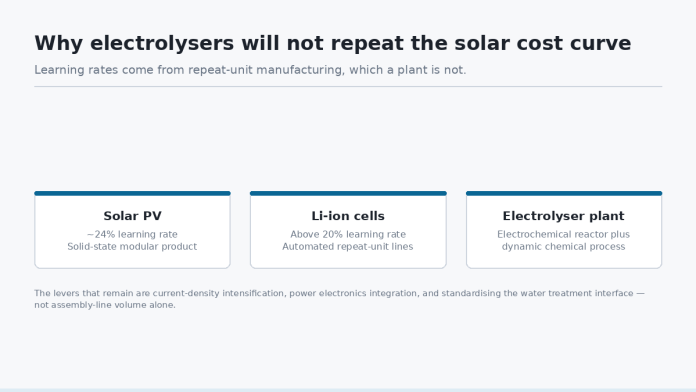
Over the past decade, renewable energy literature has leaned heavily on Wright’s Law to forecast the economics of deep decarbonization. Solar photovoltaics achieved a learning rate of roughly 24%—meaning that for every doubling of cumulative installed capacity, module costs fell by nearly a quarter. Lithium-ion battery cells demonstrated similar empirical learning rates exceeding 20%. However, applying these precise cost-reduction trajectories directly to green hydrogen systems fundamentally oversimplifies the underlying physics and plant engineering.
A solar module or battery cell is a solid-state, modular product manufactured on highly automated assembly lines with immense repeat-unit density. An industrial green hydrogen facility, by contrast, is a hybrid between a high-power electrochemical reactor and a complex, dynamic chemical processing plant. While the electrolyzer stack itself benefits from automated cell manufacturing, the total balance of plant (BOP)—comprising rectifiers, gas-liquid separators, deoxodiene purification units, high-pressure compressors, and complex water treatment loops—dominates capital expenditure (CAPEX).
To drive green hydrogen down the cost curve toward levelized cost of hydrogen (LCOH) targets of 2.00/kg, engineering focus must expand beyond simple gigawatt-scale stack assembly lines. Real progress requires multi-variable process intensification, thermal integration, and standardized plant design.
Electrochemical Stack Physics and Material Intensification
To understand where stack-level cost reductions originate, we must analyze operational current density, catalyst loading, and membrane resistance. Today, Proton Exchange Membrane (PEM) electrolyzers typically operate at current densities between 1.5 and 2.5 A/cm2 at cell voltages ranging from 1.8 V to 2.1 V. PEM technology relies on scarce platinum-group metals (PGMs), specifically iridium dioxide (IrO2) at the oxygen-evolving anode and supported platinum (Pt) at the hydrogen-evolving cathode.
The primary learning vector for PEM stack engineering is drastically lowering PGM loading without accelerating voltage decay rates. Baseline commercial designs historically utilized 1.5 to 2.0 mg Ir/cm2. Next-generation membrane electrode assemblies (MEAs) target loadings below 0.3 mg Ir/cm2 by deploying high-surface-area titanium support structures and thin-film magnetron sputtering deposition. Concurrently, decreasing membrane thickness from 175 µm down to under 50 µm reduces internal ohmic resistance (ηohmic), enabling current densities up to 4.0 A/cm2 while keeping stack efficiency above 65% based on Lower Heating Value (LHV).
“The true metric for electrolyzer cost scaling is not dollars per kilowatt of nameplate power, but dollars per kilogram of high-purity hydrogen delivered across dynamic operating profiles.”
For Alkaline Electrolysis (AEL), which historically operated at lower current densities of 0.3 to 0.6 A/cm2, the learning curve relies on shifting from traditional liquid KOH porous diaphragms to Zero-Gap advanced alkaline architectures utilizing anion-conductive membranes. This design evolution elevates operating current density to 1.0–1.5 A/cm2, drastically reducing the physical stack volume, footprint, and steel pressure vessel requirements for a given gas output.
Industrial Water Treatment and BOP Scaling Non-Linearities
While electrolyzer stack manufacturing gains modular efficiencies through automation, the Balance of Plant follows non-linear chemical engineering scaling rules (where cost scales with capacity to an exponent of 0.6 to 0.7). Among these subsystems, industrial water treatment represents both a strict thermodynamic boundary condition and a critical area for process optimization.
Stoichiometrically, splitting water requires exactly 8.93 kg of pure H2O per 1 kg of H2 produced. In real-world plant operations, however, raw water intake ranges from 18 to 30 kg per kg of H2 due to reverse osmosis (RO) reject streams, continuous blowdown, and cooling tower evaporation. High-purity stack operation demands water quality with electrical conductivity strictly below 0.1 µS/cm and resistivity approaching 18.2 MΩ·cm for PEM cells to prevent catalyst poisoning and parasitic shunt currents through fluid manifolds.
Dynamic Water Loop Architecture
A robust industrial water treatment train for utility-scale green hydrogen projects typically combines multi-media media filtration, double-pass Reverse Osmosis (RO), continuous Electrodeionization (EDI), and ultraviolet disinfection. When electrolyzer units operate dynamically alongside variable wind or solar power, water treatment systems face severe transient hydraulic and thermal shocks. Rapid cycling causes pressure fluctuations across membrane modules and alters feed conductivity, risking scale precipitation (calcium carbonate, silica) on RO membranes.
Engineering the water treatment island with variable-frequency drive pumps, modular buffer storage, and real-time total organic carbon (TOC) monitoring is mandatory. Integrating process heat recovery from the electrolyzer cooling loop (which handles 25–35% of total input energy as waste heat at 60–80°C) directly into the pre-treatment RO feed stream lowers water viscosity, decreasing RO pumping energy by up to 15% and directly improving total system efficiency.
Dynamic Load Following, Degradation, and Efficiency Limits
A central engineering challenge along the learning curve is maintaining stack longevity under dynamic renewable ramp rates. When directly coupled to off-grid solar or wind, an electrolyzer may experience power ramps exceeding 10% of nominal capacity per second. Under low-load conditions (e.g., below 10–15% nominal power), differential gas pressure across ultra-thin membranes can cause hydrogen crossover into the oxygen stream, approaching lower explosive limits (4% H2 in O2) and triggering emergency safety shutdowns.
Furthermore, rapid thermal and electrical cycling accelerates degradation mechanisms. Platinum dissolution, catalyst agglomeration, and titanium porous transport layer (PTL) passivation cause cell voltage drift. At steady-state conditions, acceptable voltage degradation is below 2 to 4 µV per operating hour. Unmitigated dynamic transients can accelerate this rate threefold, reducing stack stack life from a targeted 80,000 hours down to fewer than 30,000 hours and destroying project economics.
From an energy perspective, present commercial electrolyzer systems consume between 50 and 60 kWh of electrical energy per kg of H2 at the battery limit (including power conversion and low-pressure drying). The thermodynamic lower limit is 33.3 kWh/kg (LHV) at 100% thermal efficiency, but thermoneutral operating voltages set practical system lower limits near 43 to 48 kWh/kg H2. Bridging this gap demands low-loss solid-state power topologies—such as Silicon Carbide (SiC) resonant converters—that maintain power factors above 0.98 and high efficiency even during severe turn-down.
Key Variables for Engineering Practitioners to Monitor
For engineering leads, EPC contractors, and plant developers evaluating green hydrogen technology over the coming decade, three technical indicators will define real movement down the learning curve:
1. End-of-Life Specific Power Consumption (kWh/kg H2): Evaluate vendor performance metrics not at clean factory acceptance testing (FAT), but at 40,000+ operating hours when cell voltage degradation has elevated operational energy requirements.
2. BOP Skid Standardization: Prioritize fully integrated, containerized balance-of-plant designs where power conversion, industrial water treatment, and gas deoxodiene purification units are pre-assembled and factory-tested to minimize field piping and wiring costs.
3. Dynamic Turn-Down Ratios without Nitrogen Purging: Focus on electrolyzer architectures incorporating active differential pressure control and catalytic recombiners, enabling safe turn-down to 5% of nominal capacity without demanding costly nitrogen sweep cycles during low-renewable periods.