
1. Introduction: The Critical Role of Water Treatment in Hydrogen Hubs
As multi-megawatt and gigawatt-scale green hydrogen projects transition from concept to operational deployment, Process Engineers face significant balance-of-plant (BOP) challenges. Among these, feed water purification represents both a major operational expenditure and a critical point of failure. The heart of any power-to-gas facility is the Electrolyzer, a system highly sensitive to chemical contaminants. Whether utilizing Proton Exchange Membrane (PEM), Alkaline Electrolysis (AEL), or Solid Oxide Electrolysis Cells (SOEC), the feed water must be purified to stringent Ultrapure Water (UPW) specifications—typically ASTM Type I or ISO 3696 Grade 1.
Failing to maintain continuous UPW quality results in rapid degradation of the electrolyzer membrane electrode assemblies (MEAs), severe catalyst poisoning, and reduced Faradaic efficiency. Consequently, robust integrated Water Treatment architecture—centered around optimized Reverse Osmosis (RO) systems—is required to ensure continuous operational uptime, minimal life-cycle costs, and long stack longevity.
2. Ultrapure Water (UPW) Demands and Stack Degradation Dynamics
2.1 Water Quality Specifications for Electrolysis
Modern low-temperature electrolyzers demand ultrapure water with a electrical resistivity of 18.2 MΩ·cm at 25 °C (equivalent to a conductivity of 0.055 µS/cm). Beyond bulk conductivity, strict upper thresholds exist for specific chemical species:
- Total Organic Carbon (TOC): < 5 ppb
- Dissolved Silica (SiO2): < 3 ppb
- Heavy Metal Cations (Fe, Cu, Ni, Cr): < 0.1 ppb
- Halides (Cl–, F–): < 0.5 ppb
2.2 Contamination and Stack Degradation Kinetics
The impact of water impurities on electrolyzer performance is directly reflected in the cell operating voltage equation:
Vcell = Erev + ηanode + ηcathode + i · Rohmic + ηmass_transport
Where Erev is the reversible thermodynamic cell potential (1.23 V at standard conditions), ηanode and ηcathode represent the anodic and cathodic activation overpotentials, i is the operational current density (A/cm2), Rohmic is the area specific ohmic resistance (Ω·cm2), and ηmass_transport is the mass transport overpotential.
“A mere 10 ppb concentration of transition metal cations (Fe2+, Cu2+) in feed water can cause irreversible ion-exchange site poisoning within Proton Exchange Membrane (PEM) cells, precipitating a 15% increase in cell ohmic resistance (i·Rohmic) over 1,000 operational hours.”
Trace metal cations compete with hydronium ions (H+) for sulfonic acid active sites (-SO3–) within the Perfluorosulfonic Acid (PFSA) polymer matrix (e.g., Nafion). Cation exchange reduces proton conductivity, driving up Rohmic. Furthermore, multivalent metal ions catalyze the Fenton reaction in the presence of oxygen and hydrogen, producing hydroxyl (•OH) and hydroperoxyl (•OOH) radical species that attack the polymer backbone, leading to membrane thinning, increased gas crossover, and eventual catastrophic stack short-circuiting.
3. Integrated Water Treatment Architecture
To produce UPW from variable raw water sources (groundwater, surface water, municipal wastewater effluent, or seawater), a multi-barrier pretreatment and purification train is required.
| Process Stage | Primary Technology | Target Contaminants Removed | Typical Effluent Quality |
|---|---|---|---|
| Pretreatment | UF / MMF + Cartridge Filters | Suspended Solids, Colloids, Turbidity (SDI < 3) | Turbidity < 0.1 NTU |
| Primary Desalination | First-Pass Reverse Osmosis (RO) | Dissolved Ions (TDS), High MW Organics | TDS < 10 mg/L (99% Rejection) |
| Secondary Desalination | Second-Pass RO / CCRO | Residual Ions, CO2 (with Degasification) | Conductivity < 2–5 µS/cm |
| Polishing | Continuous Electrodeionization (CEDI) | Trace Ions, Weakly Ionized Silica, Boron | Resistivity 10–16 MΩ·cm |
| Ultra-Polishing | Mixed-Bed Ion Exchange (MBIX) + UV | Sub-ppb Cations/Anions, Micro-organism breakdown | Resistivity 18.2 MΩ·cm, TOC < 5 ppb |
4. Reverse Osmosis (RO) Process Engineering and Optimization
4.1 Mass Transport and Osmotic Pressure Governing Equations
The operational flux Jw (L/m2/h) across high-rejection polyamide thin-film composite (TFC) RO membranes is defined by the solution-diffusion model:
Jw = A · (ΔP – Δπ) = A · [(Pfeed – Ppermeate) – (πmembrane – πpermeate)]
Where A is the water permeability coefficient, ΔP is the net applied hydraulic pressure differential across the membrane, and Δπ is the osmotic pressure differential across the active skin layer. The feed osmotic pressure π (bar) is estimated using the van ‘t Hoff equation for dilute-to-moderate aqueous solutions:
π = R · T · ∑(i · Ci)
Where R is the ideal gas constant (0.08314 L·bar/mol·K), T is the absolute temperature in Kelvin, Ci is the molar concentration of ionic species i, and i is the van ‘t Hoff dissociation factor. Managing concentration polarization at the membrane boundary layer is essential to avoid localized saturation of sparingly soluble salts like CaSO4, BaSO4, and SiO2.
“Treating the water treatment plant as an isolated utility rather than an integrated thermodynamic system with the Electrolyzer process loop is the leading cause of dynamic efficiency loss in renewable-powered green hydrogen facilities.”
4.2 Dynamic Load Following in Renewable-Coupled Facilities
Green hydrogen facilities operated via off-grid solar PV or wind assets experience high power variability. Conventional RO units prefer continuous, steady-state hydraulic conditions; frequent start-stop cycles drive membrane fatigue and cause osmotic backwash, damaging the polyamide separation layer.
To overcome this, modern Hydrogen Hubs implement Closed-Circuit Reverse Osmosis (CCRO) or multi-stage flexible feed configurations. CCRO operates in a semi-batch mode, recirculating the pressurized stream until a target recovery (e.g., 85–90%) is achieved before flushing the brine concentrated pocket. This approach delivers several operational advantages:
- Variable Recovery Flexibility: Dynamic adjustments in recovery based on real-time raw water temperature and electrical power input.
- Fouling Mitigation: Continuous variations in flux and cross-flow velocity disrupt bio-fouling and prevent concentration polarization boundary layers from forming stable mineral scale nuclei.
- Energy Efficiency: Eliminates the need for energy-intensive second-pass RO systems in moderate-TDS feed scenarios, keeping energy consumption low.
4.3 Energy Recovery Device (ERD) Integration
To optimize the overall Specific Energy Consumption (SEC) of the facility, high-pressure RO reject lines are coupled with Isobaric Energy Recovery Devices (e.g., rotary pressure exchangers). ERDs transfer pressure directly from the high-pressure concentrate stream to the fresh feed stream with mechanical thermodynamic efficiencies exceeding 98%.
SECRO = (Pfeed · Qfeed – Pbrine · Qbrine · ηERD) / (36 · Qpermeate · ηpump)
Using isobaric ERDs reduces the primary desalination energy penalty from ~3.5 kWh/m3 down to 1.8–2.2 kWh/m3 of permeate produced. This corresponds to a negligible parasitic load of less than 0.05 kWh/kg of produced hydrogen.
5. System Mass Balance & Zero Liquid Discharge (ZLD) Integration
5.1 Stoichiometric vs. Real-World Water Demands
Stoichiometrically, splitting water requires minimal mass:
2 H2O (l) → 2 H2 (g) + O2 (g)
Based on molecular weights, 17.98 g of H2O yields 2.016 g of H2, yielding a minimum theoretical ratio of 8.92 kg H2O per 1 kg H2. However, practical operations demand higher water throughput due to continuous system purges, electrode flushing, CEDI reject, RO recovery limits, and cooling tower evaporation balance.
In a standard 100 MW PEM facility operating at 50 kWh/kg H2, producing 2,000 kg H2/h, the mass balance yields:
- Stoichiometric UPW Consumption: 17.84 m3/h
- Electrode Purge & Polishing Losses (90% yield): 19.82 m3/h UPW required
- Two-Pass RO System (80% overall recovery): 24.78 m3/h raw feed water needed
- Cooling Tower Evaporation & Blowdown (if evaporative cooling is used): ~20 to 30 m3/h
- Total Raw Water Intake Requirement: ~22 to 27 kg H2O / kg H2
5.2 Minimizing Wastewater via Brine Concentration
In arid regions—where green hydrogen projects are often sited due to abundant solar irradiance—minimizing waste discharge is critical. Integrating High-Pressure Reverse Osmosis (HPRO) or Electrodialysis Reversal (EDR) to treat primary RO brine allows recovery rates to increase to 95%, achieving Minimum Liquid Discharge (MLD) status. The remaining concentrate can be fed into a mechanical vapor recompression (MVR) crystallizer for Zero Liquid Discharge (ZLD), recovering solid salts for commercial off-take.
6. Strategic Engineering Recommendations
- Implement Real-Time On-Line TOC and Conductivity Analytics: Fast-response analytical loops upfront of the electrolyzer stack are required to trigger automated emergency shut-off valves before micro-contaminants can foul catalyst layers.
- Utilize Dynamic Thermal Integration: Heat generated by electrolyzer inefficiencies (approx. 15–20% of total stack input energy converted to low-grade waste heat at 55–70 °C) should be harvested to preheat RO feed streams. Raising RO feed water temperature improves membrane permeability (increasing flux Jw by approximately 2.5% per °C), thereby lowering required high-pressure pump driving energy.
- Design Flexible Buffer Systems: Integrate intermediate UPW storage tanks (utilizing nitrogen blankets to isolate water from atmospheric CO2 and oxygen absorption) between the CEDI system and the electrolyzer modules. This decouples variable pretreatment operation from intermittent hydrogen production profiles.
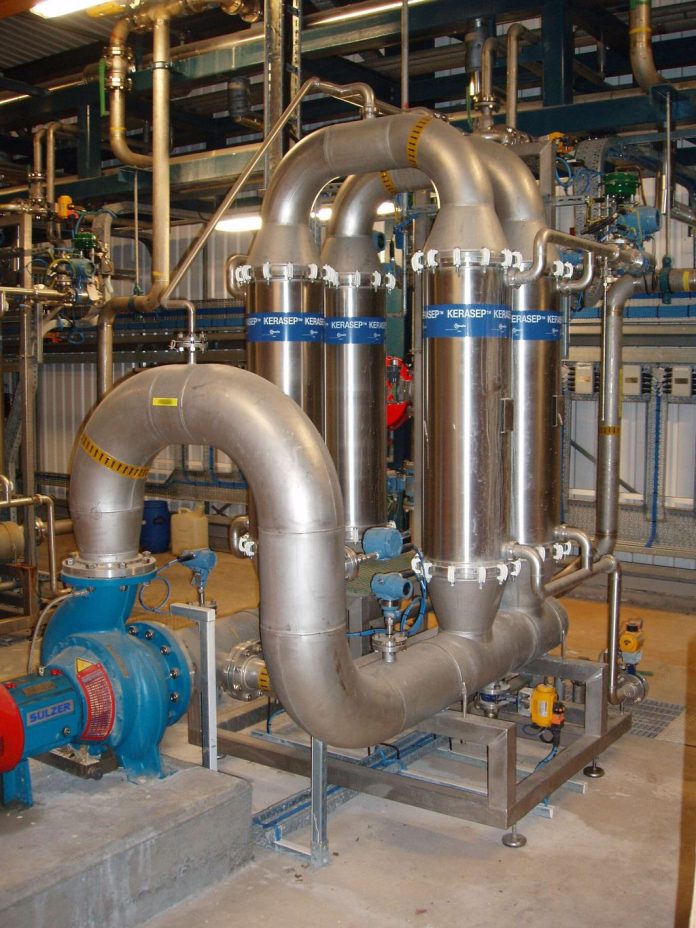
Image: Filtration unit (crossflow filtration) by Wikiwayman (talk), licensed under CC BY-SA 3.0.