

The Physical Constraints of Bulk Hydrogen Vectors
The core challenge of cross-border hydrogen trade is volumetric energy density. Under standard ambient conditions, gaseous molecular hydrogen (H2) possesses a lower heating value (LHV) of 120 MJ/kg (33.3 kWh/kg), making it gravimetrically superior to fossil hydrocarbons. However, its ambient volumetric density is a negligible 0.089 kg/m3, corresponding to roughly 0.003 kWh/L. Compressing gaseous H2 to 350 bar or 700 bar increases volumetric density to roughly 0.8 kWh/L and 1.3 kWh/L, respectively—insufficient for long-distance maritime transport where vessel payload volume drives commercial viability.
To move hydrogen across ocean trade routes at gigawatt scale, engineering teams must transform the gas into a dense liquid vector. The three primary vectors evaluated across global trade corridors are liquefied hydrogen (LH2), ammonia (NH3), and Liquid Organic Hydrogen Carriers (LOHC), such as dibenzyltoluene. Each vector presents stark thermodynamic trade-offs that dictate process equipment design, capital expenditure, and round-trip efficiency (RTE).
Carrier Thermodynamics: LH2, Ammonia, and LOHC
1. Cryogenic Liquefied Hydrogen (LH2)
Liquefying pure hydrogen requires cooling the gas to its boiling point of -253 °C (20 K) at 1 atm. This process demands substantial mechanical work to overcome the ortho-to-para spin isomer conversion. Uncatalyzed ortho-hydrogen spontaneously converts to para-hydrogen via an exothermic reaction (0.527 kJ/mol H2), releasing enough heat to boil off the liquid during transit. Modern liquefaction plants utilize continuous iron-oxide catalysts across multi-stage helium-neon refrigeration cycles, but electrical energy consumption remains high at 10 to 12 kWh/kg H2—equivalent to roughly 30% to 36% of the hydrogen’s LHV energy content.
Aboard transport vessels, boil-off rates (BOR) are typically managed between 0.15% and 0.3% per day using vacuum-insulated double-walled containment. At destination ports, LH2 can be directly pumped and regasified with minimal chemical processing, making it optimal for ultra-pure end-use applications, provided cryogenic transfer infrastructure is available.
2. Chemical Carrier: Synthetic Ammonia (NH3)
Synthesizing ammonia via the Haber-Bosch process involves reacting hydrogen with nitrogen separated from air via a cryogenic Air Separation Unit (ASU). Operating at 150 to 250 bar and 400 to 500 °C over iron-based catalysts, Haber-Bosch synthesis yields a liquid product under moderate refrigeration (-33 °C at ambient pressure) or low pressure (8.5 bar at 20 °C), yielding a volumetric energy density of 3.2 kWh/L.
Ammonia benefits from decades of established maritime handling infrastructure, but cracking it back to high-purity hydrogen at the import terminal introduces a severe thermal penalty. Endothermic cracking requires 30.6 kJ/mol H2 (roughly 4.2 kWh/kg H2) at temperatures exceeding 500 °C, alongside complex pressure swing adsorption (PSA) purification steps to reduce residual ammonia concentrations below 0.1 ppm for polymer electrolyte membrane (PEM) fuel cell applications.
“When engineering hydrogen trade routes, the transport carrier is not merely a vessel; it is a chemical process plant operating on a thermodynamic balance sheet.”
3. Liquid Organic Hydrogen Carriers (LOHC)
LOHC technologies utilize aromatic hydrocarbon oils to chemically bind hydrogen via catalytic hydrogenation at 30 to 50 bar and 150 to 200 °C. The carrier remains liquid under ambient conditions, utilizing existing diesel and crude oil infrastructure. However, the dehydrogenation step at the receiving terminal is highly endothermic, requiring operational temperatures of 270 to 320 °C and consuming 9 to 11 kWh/kg H2 in thermal energy, severely impacting net energy yield if waste heat from heavy industrial processes is unavailable.
Upstream Integration: Electrolyzers and Water Treatment
The upstream generation plant sets the baseline energy efficiency and purity profile for the entire export terminal. Bulk hydrogen export facilities rely on massive electrolyzer arrays integrated directly with high-voltage renewable energy generation (wind and solar photovoltaic).
Modern commercial electrolyzers fall into two dominant operational categories:
- PEM Electrolyzers: Operating at current densities of 1.5 to 2.5 A/cm2 and cell voltages of 1.8 to 2.1 V, PEM systems deliver elevated output pressures (30 to 50 bar) directly from the stack, saving downstream compression energy. Stack-level specific energy consumption averages 50 to 55 kWh/kg H2.
- Alkaline Electrolyzers (AEL): Operating at lower current densities (0.4 to 0.8 A/cm2) and pressures (1 to 30 bar), AEL systems provide lower capital expenditure per kilowatt but require greater footprint and yield higher parasitic load for gas drying and purification. System-level consumption ranges between 52 and 58 kWh/kg H2.
A critical, often underestimated constraint in export design is industrial water treatment. Electrolysis requires feed water of extreme purity to prevent catalyst degradation and membrane fouling. ASTM Type I water purity with a electrical conductivity below 0.1 µS/cm and total organic carbon (TOC) under 50 ppb is mandatory.
Stoichiometrically, splitting water requires 8.93 kg of pure H2O per 1 kg of H2 gas. However, real-world plant mass balances demand significantly higher gross intake. A typical seawater reverse osmosis (SWRO) facility coupled with multi-stage electrodeionization (EDI) operates at continuous recovery rates of 40% to 50%. Accounting for continuous purging, electrode cooling loop bleed-off, and backwashing, an export-scale green hydrogen facility consumes between 18 and 25 kg of raw source water per kilogram of H2 produced. In arid coastal export regions, desalination equipment must be designed with redundant pretreatment membranes to handle seasonal algae blooms without tripping the electrolyzer stacks.
Critical Variables for Engineering Practitioners
When modeling hydrogen trade economics and design flows, engineers should focus on four primary variables:
1. System-Level Round-Trip Efficiency (RTE): Calculate RTE from renewable AC input to delivered gas at the import boundary. Direct gaseous pipeline export yields 75% to 85% RTE; LH2 shipping yields 55% to 65% RTE; Ammonia with full cracking yields 35% to 50% RTE. Direct ammonia cracking must be avoided if the end-user can utilize the NH3 molecule directly as feedstock (e.g., fertilizer manufacturing).
2. Thermal Coupling at Import Terminals: Ensure LOHC dehydrogenation or ammonia cracking facilities are co-located with high-temperature waste heat sources (e.g., steel mills, glass foundries, or industrial heat pumps) to supply the necessary reaction enthalpy without burning a portion of the imported hydrogen payload.
3. Impurity Tolerances: Carrier cracking products contain trace impurities (NH3, CO, CO2, sulfur species). ISO 14687 Grade D standards dictate strict limits (e.g., < 0.004 ppm NH3) for fuel cell vehicles. Purity specifications must drive PSA and membrane separation module sizing at the receiver terminal.
4. Dynamic Load Balancing: Green hydrogen export facilities operating off-grid must manage fast transient ramps. Electrolyzers and downstream chemical plants (like Haber-Bosch loops) have opposing dynamic response capabilities. Buffer storage arrays (gaseous tube trailers or salt caverns operating at 200 to 500 bar) must be engineered between the electrolyzer outlet and the carrier synthesis unit to absorb dynamic renewable generation fluctuations.
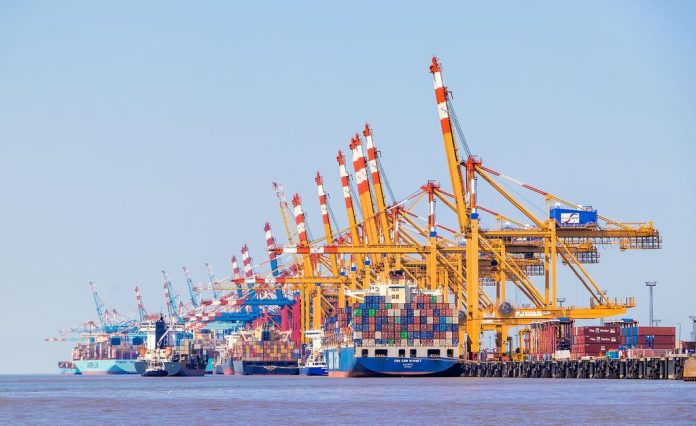
Image: Container-Terminal Bremerhaven 01 by H. Zell, licensed under CC BY-SA 3.0.