
Navigating India’s Green Hydrogen Transition: Engineering Challenges, Infrastructure Gaps, and Economic Realities Facing the National Mission
Engineering Insight: India’s ambitions to position itself as a global epicenter for green hydrogen production are entering a critical execution phase. Driven by the Nation…
India’s ambitions to position itself as a global epicenter for green hydrogen production are entering a critical execution phase. Driven by the National Green Hydrogen Mission (NGHM) with an overarching target of producing 5 million metric tonnes (MMT) per annum by 2030, the country is attempting a radical decarbonization of its heavy industrial base. However, a comprehensive intelligence report released by SBICAPS (SBI Capital Markets Ltd) highlights that while initial policy momentum, tender activity, and subsidy allocations under the Strategic Interventions for Green Hydrogen Transition (SIGHT) scheme are robust, severe engineering, infrastructure, and financial bottlenecks threaten to derail execution timelines.
From an advanced process engineering and infrastructure consulting perspective at Avoltium.in, achieving economic viability in green hydrogen deployment demands far more than renewable capacity additions. It requires solving intricate thermodynamic inefficiencies, optimizing balanceofplant (BOP) architectures, establishing high-pressure midstream transport, and restructuring the levelized cost of hydrogen (LCOH) stack. This technical deep dive analyzes the core engineering constraints, gridintegration dynamics, technological choices, and structural market hurdles outlined in the SBICAPS report.
Technical Breakdown
The transition from fossilderived grey hydrogen—produced via Steam Methane Reforming (SMR) with carbon intensities exceeding 910 kg CO2 per kg H2—to electrolytic green hydrogen requires unprecedented scaling of electrochemical plant architectures. The core engineering challenges within the green hydrogen value chain center on electrolyzer selection, balance of plant (BOP) integration, and dynamic power coupling.
1. Electrolyzer Stack Engineering and Degradation Physics
The core of any green hydrogen production facility is the electrolyzer stack. Indian developers are currently navigating complex tradeoffs between the three primary commercial and emerging electrolyzer technologies:
- Alkaline Electrolyzers (AEL): Operating with liquid potassium hydroxide (KOH, typically 2030 wt%) as the electrolyte, AEL systems present the lowest capital expenditure (CAPEX) footprint (300600/kW for domestic/Chinese stacks). However, they suffer from low current densities (0.20.6 A/cm²), limited dynamic turndown ratios (20100%), and slow transient response times (minutes to hours). Under fluctuating renewable energy inputs, crosspermeation of hydrogen and oxygen across the porous separator poses severe safety risks regarding explosive gas mixtures, necessitating baseline continuous power operation.
- Proton Exchange Membrane (PEM): Utilizing a solid perfluorosulfonic acid (PFSA) polymer membrane, PEM systems excel in dynamic operations, reacting in milliseconds to variable solar and wind profiles. Operating at high current densities (>1.52.0 A/cm²), PEM allows for compact plant footprints. However, stack CAPEX remains high (8001,300/kW) due to heavy reliance on expensive Platinum Group Metals (PGM)—specifically iridium dioxide (IrO2) at the anode and platinum (Pt) at the cathode—alongside titaniumbased porous transport layers (PTLs). Stack degradation accelerated by power ramping cycling remains a major thermal and mechanical stressor, reducing operating lifespans to between 40,000 and 60,000 hours before membrane electrode assembly (MEA) replacement is required.
- Solid Oxide Electrolyzer Cells (SOEC): Operating at elevated temperatures (650°C850°C), SOEC leverages hightemperature ceramic membranes (e.g., YttriaStabilized Zirconia) to achieve electrical efficiencies approaching 8590% (LHV) when integrated with external waste heat sources (such as steel blast furnaces or chemical synthesis units). Despite superior thermodynamics, thermal mechanical stress during dynamic cycling, cell delamination, and seal degradation currently limit its Technology Readiness Level (TRL) for broad commercial deployment in India.
2. Balance of Plant (BOP) Optimization and Auxiliary Loads
While electrolyzer stacks receive primary focus, the Balance of Plant (BOP) represents up to 50% of total facility CAPEX and consumes significant parasitic power, directly degrading net plant efficiency:
- UltraPure Water (UPW) Systems: Water electrolysis demands pristine feedstock quality (ASTM Type I/II with electrical resistivity >18.2 MΩ·cm). Producing 1 kg of green hydrogen stoichiometrically consumes 9 liters of pure water; however, accounting for demineralization, Reverse Osmosis (RO), Electrodeionization (EDI), and blowdown losses, the actual consumption reaches 1824 liters of raw water per kg H2. In waterstressed industrial clusters across Gujarat, Rajasthan, and Tamil Nadu, integrating energyintensive seawater desalination units adds roughly 0.10.3 kWh/kg H2 in auxiliary electrical power.
- Power Electronics and Rectification: Converting HighVoltage AC grid power to high-current, lowvoltage DC power for electrolyzers introduces conversion losses and power quality issues. Advanced IGBTbased active frontend rectifiers are mandatory to maintain high power factor (>0.98), minimize Total Harmonic Distortion (THD <3%), and avoid penalty tariffs imposed by state transmission utilities.
- Gas Cleanup and DeOxo Systems: Raw hydrogen offgas from electrolyzers contains moisture and trace oxygen (>1002,000 ppm). Achieving fuel cell grade or chemical synthesis grade purity (99.999%) requires passing the gas through catalytic DeOxo beds (combining O2 and H2 to form water over a palladium catalyst) followed by dualtower Pressure Swing Adsorption (PSA) or Temperature Swing Adsorption (TSA) dryers, adding thermal and pressure losses across the process flow.
3. Renewable Energy Intermittency and Grid Integration Dynamics
Electrolyzer capacity factors severely dictate amortized stack costs. Running electrolyzers solely on unbuffered solar photovoltaic (PV) power yields a low Capacity Utilization Factor (CUF) of ~2225%, resulting in unsustainably high fixedcost amortization per kilogram of hydrogen produced. To achieve economical operation (>7080% CUF), facilities must combine utilityscale solar PV, onshore wind, and energy storage systems via Firm and Dispatchable Renewable Energy (FDRE) models.
Managing grid stability under the Indian Electricity Grid Code (IEGC) requires complex dynamic power control interfaces. Rapid voltage transients, frequency fluctuations, and loadfollowing ramping put severe stress on power electronics and electrolyzer membrane interfaces. Developers must install fastresponding Battery Energy Storage Systems (BESS) or pumphydro storage to buffer millisecondtominute power drops, incurring additional capital overlays.
Market & Economic Impact
The economic viability of green hydrogen hinges entirely on lowering the Levelized Cost of Hydrogen (LCOH). Currently, the commercial production cost of green hydrogen in India ranges between 4.50 and 6.50 per kg, compared to conventional grey hydrogen costs of 1.50 to 2.50 per kg. Closing this massive cost parity gap is the core mandate of the National Green Hydrogen Mission, but market structural realities impose sharp boundaries.
1. Breakdown of Levelized Cost of Hydrogen (LCOH)
The LCOH formula demonstrates extreme sensitivity to input electricity tariffs and electrolyzer CAPEX:
“$LCOH = LCOH = [ CAPEXinstalled + Σt=1..n (OPEXt + Electricity Costt) / (1+r)t ] ÷ [ Σt=1..n Hydrogen Outputt / (1+r)t ]
Key economic levers governing Indian projects include:
- Electricity Tariff (6070% of LCOH): Power is the dominant operational expense. To reach an LCOH of ~2.00/kg, the delivered renewable power tariff to the electrolyzer terminals must fall below ₹2.00₹2.50/kWh (0.0240.030/kWh). While raw solar PV generation tariffs in India have dropped to ~₹2.60/kWh, addition of wheeling charges, crosssubsidy surcharges (CSS), additional surcharges (AS), transmission losses, and banking charges rapidly elevates the landed power tariff above ₹4.50₹5.50/kWh unless complete longterm InterState Transmission System (ISTS) charge waivers are effectively utilized.
- Electrolyzer CAPEX and Manufacturing Scale: Domestic manufacturing under the SIGHT Scheme (Mode 1: Electrolyzer Manufacturing incentives) targets creating 3,000 MW/year of localized manufacturing capacity. However, early domestic assembly lines remain reliant on imported raw components (PFSA membranes, catalystcoated membranes, titanium plates). Without localizing the deep Tier2 and Tier3 raw material supply chains, initial cost reductions will remain modest.
2. Infrastructure, Midstream Storage, and Transport Bottlenecks
The SBICAPS report highlights the nearcomplete absence of dedicated midstream green hydrogen infrastructure in India. Hydrogen’s low volumetric energy density (3 kWh/m³ at ambient conditions vs. 10 kWh/m³ for natural gas) creates complex transport logistics:
- Gaseous Tube Trailers: Moving hydrogen via high-pressure compressed gas tube trailers (200 bar to 500 bar) using Type III or Type IV carbonfiber composite cylinders is economically viable only for short distances (<200 km). Compression work consumes 812% of the energy content of the hydrogen itself.
- Cryogenic Liquid Transport: Liquefying hydrogen requires cooling it to -253°C at ambient pressure. The liquefaction process is immensely energyintensive, consuming 3040% of the lower heating value (LHV) of the hydrogen gas. Cryogenic liquid tankers offer higher volumetric density but entail extreme CAPEX and boiloff gas (BOG) thermal losses.
- Pipeline Infrastructure and Natural Gas Blending: Dedicated hydrogen pipelines are the most costeffective longdistance distribution vector. However, retrofitting existing natural gas transmission networks (operated by GAIL, GSPL, etc.) is limited by hydrogen embrittlement in highstrength carbon steels and microleakage through pipeline seals. Current technical limits constrain natural gas blending to 510% by volume without significant pipeline segment replacements and compressor station overhauls.
- Chemical Carrier Vectors (Green Ammonia / LOHC): Converting green hydrogen to Green Ammonia (NH3) via the HaberBosch process provides a dense, proven liquid carrier (-33°C at ambient pressure) easily transportable via existing maritime and rail logistics networks. However, the energy penalty of synthesis followed by cracking (reconversion back to H2 at the destination) reduces roundtrip energy efficiency to below 5055%.
3. Demanding Offtake Obligations and Regulatory Mandates
The core structural obstacle identified by industry analysts is the offtake deficit. Financial institutions require longterm, bankable, fixedprice Offtake Agreements (1520 year Power Purchase Agreement equivalents) to finance capitalheavy hydrogen projects. However, primary industrial consumers—refineries, fertilizer units, and steel producers—are reluctant to enter binding contracts at current cost differentials without clear enforcement of mandatory green hydrogen consumption obligations (GHCOs).
Industrial Sector Current H2 Application Green Substitution Path Core Challenge to Adoption Petroleum Refining Hydrotreating & Hydrocracking (Grey H2) Direct replacement with electrolytic Green H2 High cost impact on enduse refined fuels; thin margins. Fertilizers Ammonia Synthesis (NH3) for Urea Green Ammonia replacing SMRderived feedstock Requires government subsidy restructuring under the Fertilizer Subsidy Scheme. Steel Manufacturing Coal/Coke Reduction in Blast Furnaces Direct Reduced Iron (DRI) using 100% Green H2 Requires structural overhaul of shaft furnaces; extreme CAPEX requirement. Future Outlook
India’s National Green Hydrogen Mission stands at a crucial juncture where policy ambition must align with rigorous engineering execution and marketdriven incentives. To overcome the structural issues highlighted in the SBICAPS report, the ecosystem must accelerate action across several priority axes over the next 24 to 36 months.
1. Strategic Localization of HighValue Supply Chains
To reduce dependence on volatile global supply chains, domestic manufacturers winning SIGHT incentives must rapidly vertically integrate. Manufacturing localized porous transport layers, catalyst coatings, advanced bipolar plates, and precision power electronics within India will be essential to driving stack costs toward the 300/kW mark before 2030.
2. Development of PortAnchored Industrial Clusters (Hydrogen Hubs)
Given midstream transport limitations, the shorttomedium term growth of green hydrogen in India will concentrate in integrated, colocated industrial hubs. Coastal regions with deepwater ports—such as Kandla, Paradip, Mangalore, and Tuticorin—are ideally situated. Colocating utilityscale renewable generation, highcapacity desalinization plants, electrolyzer arrays, and enduse chemical plants (e.g., green ammonia or green methanol for export) eliminates longdistance hydrogen pipeline transport overheads entirely.
3. Bankability Frameworks and Standardized Engineering EPC Contracts
Financial institutions remain cautious due to operational risks associated with electrolyzer stack degradation, dynamic ramping stresses, and uncertain multidecade performance guarantees. Industry standards must mature rapidly:
- Standardizing Turnkey Engineering, Procurement, and Construction (EPC) delivery models with integrated wrap guarantees covering stack lifespans and specific power consumption (kWh/kg H_2$).
- Implementing contract mechanisms like Contracts for Difference (CfD), where government entities bridge the cost gap between grey and green hydrogen market prices, guaranteeing developers a stable return while incentivizing industrial offtakers.
- Unifying national green hydrogen certification schemes with international standards (such as the EU’s RED II / RED III taxonomy mandates) to ensure Indian green ammonia exports qualify for premium global markets.
Avoltium.in Technical Summary: India’s green hydrogen momentum is genuine, underpinned by decisive fiscal framework design and immense renewable energy resources. However, overcoming the technical thresholds of balanceofplant losses, highdensity storage logistics, dynamic grid management, and LCOH nonparity will determine whether the country transforms its ambitious hydrogen roadmap into bankable, worldscale operating assets by 2030.
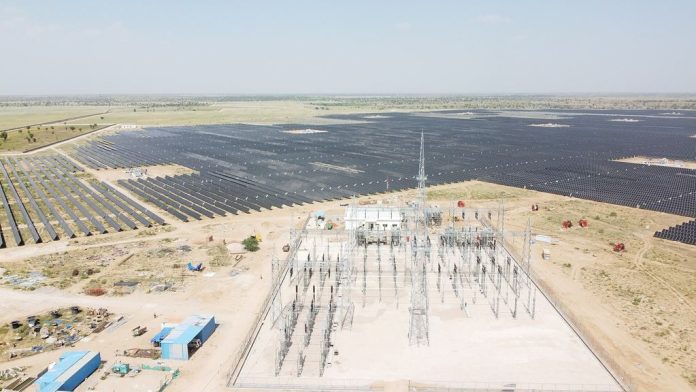
Image: AMP Energy Bhadla Solar Power Plant – 53699816551 by Sarvajanik Puralekh, licensed under CC BY-SA 2.0.
⚡ Explore Avoltium Engineering Calculators & Insights: