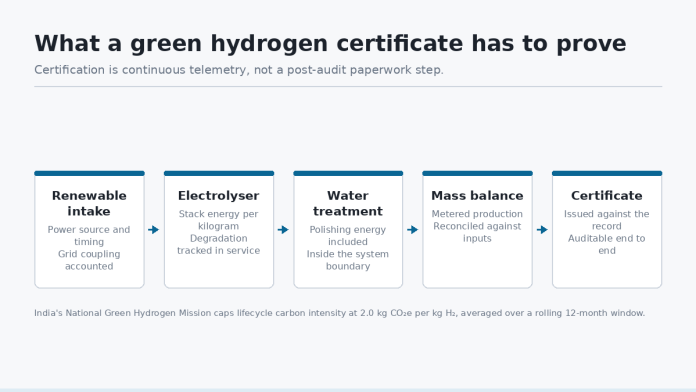

India’s launch of a centralized digital portal for green hydrogen certification represents a structural shift in how green fuels are commercialized and audited. For project developers, plant operators, and engineering consultancies, certification can no longer be treated as an administrative post-processing step handled by compliance teams. Under the framework defined by India’s National Green Hydrogen Mission, green hydrogen must maintain a lifecycle carbon intensity of no more than 2.0 kg CO2 equivalent per kilogram of H2 produced, averaged over a 12-month operating window. Achieving and proving this metric requires deeply integrated plant-level telemetry, precise mass-balance accounting, and rigorous system boundaries spanning from the renewable power intake down to the feed-water polishing units.
The Technical Architecture of Green Hydrogen Verification
At its core, a digital certification portal functions as an automated data aggregator that reconciles energy inputs against gas outputs. However, the engineering complexity lies in the temporal and spatial tracking of electricity generation, grid imports, and process auxiliary loads.
Tracking Additionality, Temporal Matching, and System Boundaries
To verify that hydrogen is truly green, certification protocols require full traceability across a defined cradle-to-gate system boundary. This boundary encompasses three distinct energy consumers within the facility:
- Primary Electrolysis Load: The direct current (DC) power supplied to the stack rectifiers.
- Process Auxiliary Loads: Balance-of-Plant (BoP) electrical demands, including cooling water pumps, mechanical chillers, dry-cooler fans, and gas purification units (deoxores) operating at pressures between 10 bar and 30 bar.
- Utility and Pre-Treatment Loads: Raw water abstraction, multi-stage water treatment systems, and initial stage gas compression (typically bringing H2 from stack delivery pressure up to storage pressures of 350 bar to 700 bar or pipeline injection pressures of 70 bar).
When renewable power is supplied via dedicated off-grid assets (behind-the-meter solar or wind), carbon accounting is straightforward. However, when plants rely on open-access grid wheeling or banking mechanisms, the portal must track hourly or 15-minute interval data from Class 0.2S revenue meters. If grid power is drawn during low-generation windows to keep electrolyzer stacks warm or maintain continuous water treatment operations, the grid’s real-time carbon intensity (often exceeding 0.7 kg CO2/kWh in coal-dominant regions) rapidly consumes the allowable 2.0 kg CO2e/kg H2 carbon budget.
Electrolyzer Performance Realities and Energy Accounting
The core energy conversion occurs inside the electrolyzer. Whether utilizing Alkaline Electrolysis (AEL), Proton Exchange Membrane (PEM), or emerging Solid Oxide Electrolyzer (SOEC) technology, the specific energy consumption per kilogram of hydrogen fluctuates continuously based on operating conditions.
System Efficiency vs. Dynamic Renewable Profiles
A typical commercial PEM electrolyzer operates at current densities between 1.5 A/cm2 and 2.5 A/cm2, with stack-level efficiency ranging from 4.2 to 4.7 kWh/Nm3 (equivalent to 46.7 to 52.2 kWh/kg H2). Once AC-DC rectifier losses (typically 2–4%), gas drying, and balance-of-plant cooling loads are included, overall plant consumption moves to 52–58 kWh/kg H2.
“Certification algorithms do not care about nameplate efficiency; they evaluate raw revenue-meter kilowatt-hours consumed against validated mass flow at the discharge header.”
Furthermore, electrolyzer efficiency is dynamic. As stacks age, cell resistance increases due to catalyst degradation, membrane thinning, and interfacial contact resistance. A typical PEM stack exhibits a degradation rate of 0.5% to 1.5% increase in cell voltage per 1,000 operating hours. Over a 60,000-hour operating lifespan, the specific power consumption of an aging plant will creep upward. An engineering team relying on early-phase performance data may find their lifecycle carbon intensity calculations drifting uncomfortably close to the maximum permissible regulatory limits as stack degradation demands more kWh per kg produced.
The Water Treatment Constraint: Sourcing and Carbon Invalidation
A frequently underestimated aspect of green hydrogen certification is feed-water sourcing and treatment energy. Stoichiometrically, splitting water requires exactly 8.94 kilograms of pure H2O to produce 1 kilogram of H2 gas. In real-world industrial systems, however, actual raw water consumption is significantly higher.
Stoichiometry vs. Real-World Water Demands
Electrolyzers demand ultra-pure feed water to prevent catalyst poisoning and membrane contamination. For PEM systems, water quality must meet ASTM Type I standards, with electrical resistivity exceeding 18.2 MΩ·cm and total organic carbon (TOC) below 10 ppb. Achieving this water purity from raw groundwater, surface water, or industrial effluent requires a comprehensive water treatment train:
- Clarification and Media Filtration
- Ultrafiltration (UF) pre-treatment
- Double-Pass Reverse Osmosis (RO)
- Electrodeionization (EDI) or Mixed-Bed Ion Exchange polishing
Due to blowdown losses, RO reject streams, and continuous EDI flush requirements, a typical industrial water treatment plant operates at an overall recovery efficiency of 60% to 75%. As a result, the plant must intake 15 to 24 kilograms of raw water for every 1 kilogram of green hydrogen produced. If seawater desalination is required, the primary energy demand of the high-pressure RO pumps (typically 3.0 to 4.5 kWh per cubic meter of purified water) adds directly to the facility’s auxiliary energy footprint.
If this water treatment system operates continuously on grid power while the main electrolyzer ramps down during non-solar hours, the carbon footprint of the water purification utility must be factored into the overall cradle-to-gate lifecycle assessment. Unaccounted auxiliary power consumption in water treatment can unexpectedly invalidate green hydrogen credentials.
Practical Engineering Directives for Plant Operators
To ensure continuous compliance with India’s certification portal and avoid batch rejection, plant engineering teams must focus on four structural implementations:
1. Direct IoT/SCADA Telemetry Integration: Install automated, encrypted data logging devices directly on Class 0.2S power meters, feed-water flow meters, and discharge gas mass flow meters. Data must be pushed via secure industrial protocols (e.g., OPC-UA, MQTT) directly to certification APIs without intermediate manual entry.
2. Coriolis Mass Flow Instrumentation: Thermal mass flow meters can introduce error margins when gas pressure and temperature fluctuate rapidly under dynamic electrolyzer operation. Precision Coriolis mass flow meters, installed at the final custody-transfer point after deoxores and dryers, provide high-accuracy mass flow measurement (±0.1% accuracy) unaffected by gas composition shifts.
3. Integrated Water-Energy Mass Balancing: Equip the water treatment plant with automated conductivity, TOC, and volumetric flow sensors at every stage (raw water intake, RO permeate, EDI product water, and discharge recovery). This provides verifiable data proving that raw water conversion ratios stay within design parameters.
4. Dynamic Emission Factor Accounting: Configure internal control systems to dynamically calculate real-time carbon intensity (kg CO2e/kg H2). If variable renewable power drops and grid import elevates the 15-minute carbon intensity above target thresholds, automated controls should ramp down electrolyzer production or switch auxiliary systems to battery storage backup.